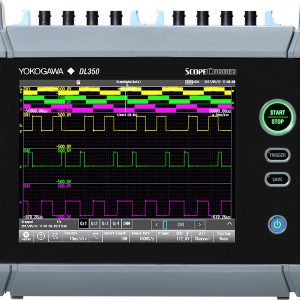
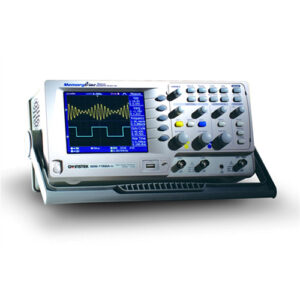
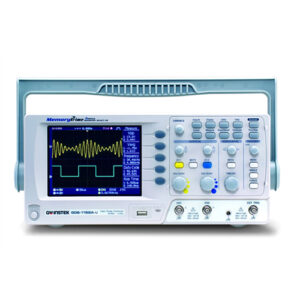
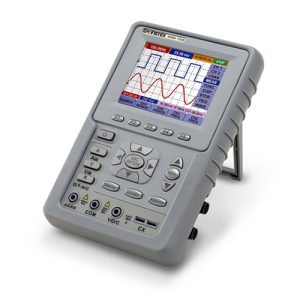
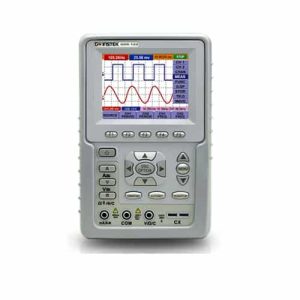
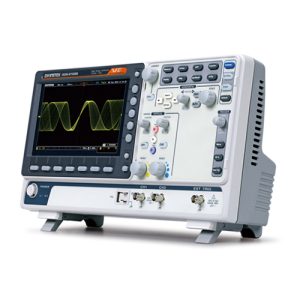
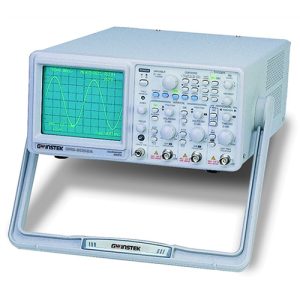
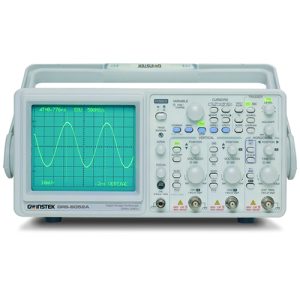
Oscilloscopes
Oscilloscopes test and display voltage signals as waveforms, visual representations of the variation of voltage over time. The signals are plotted on a graph, which shows how the signal changes. The vertical (Y) access represents the voltage measurement and the horizontal (X) axis represents time.
Call Caltest on 01483 302 700 for expert advice.
Show